Raw data lies. This warehouse checks.
A million real rows from a UK online retailer, 2009–2011. Sum them as they come and your best-selling “product” is a manual adjustment ledger, with the postman in third place. This lab builds the thing that stands between that spreadsheet and anyone making a decision: a dimensional warehouse (dbt + DuckDB) where every known trap has a test that catches it, and revenue reconciles across every layer to the penny — £18,909,762.12, four times over.
Concatenate the spreadsheet and sum: a manual adjustment ledger is your best seller and the postman is #3.
Same file, same metric, two answers. Every number above is real and regenerated by the pipeline; the flagged rows are stock codes that were never products — postage, fees, adjustments — evicted by a 61-row seed table with a test that proves each one exists in the data.
net revenue reconciled to the penny across all four layers — raw parquet, staging, intermediate, star schema. One test compares the four sums; a single cent of drift aborts the build
tests that run on every build and fail loudly. Every tolerated exception — 3,393 warehouse adjustments, five negative bad-debt prices, one cancellation with positive quantity — is pinned by name and counted, never waved through
rows duplicated between the file's two sheets — the same nine days of December 2010, present twice. Concatenate naively and revenue inflates ~2%. The warehouse removes exactly these, and a test counts them
The official UCI zip, with SHA-256 pinned for both the archive and the spreadsheet inside. A byte of drift aborts. One command rebuilds everything from the source.
Trim, normalise product codes (85123a → 85123A), money to DECIMAL, and remove the 22,523 rows the overlapping sheets duplicate — without losing a single one of the 53,628 invoices.
Facts at invoice-line grain with a surrogate key, dimensions for date, customer and product, the invoice kept as a degenerate dimension. Every foreign key tested for orphans.
Product names change over time — a whole catalogue renamed SPOTTY → POLKADOT in autumn 2010. The dimension versions every name with validity ranges; 83 renames captured, no gaps, no overlaps.
KPI marts exported as static CSV and loaded into Qlik Sense Cloud. The dashboard's numbers are checked against the warehouse to the penny — and documented as a dbt exposure in the lineage.
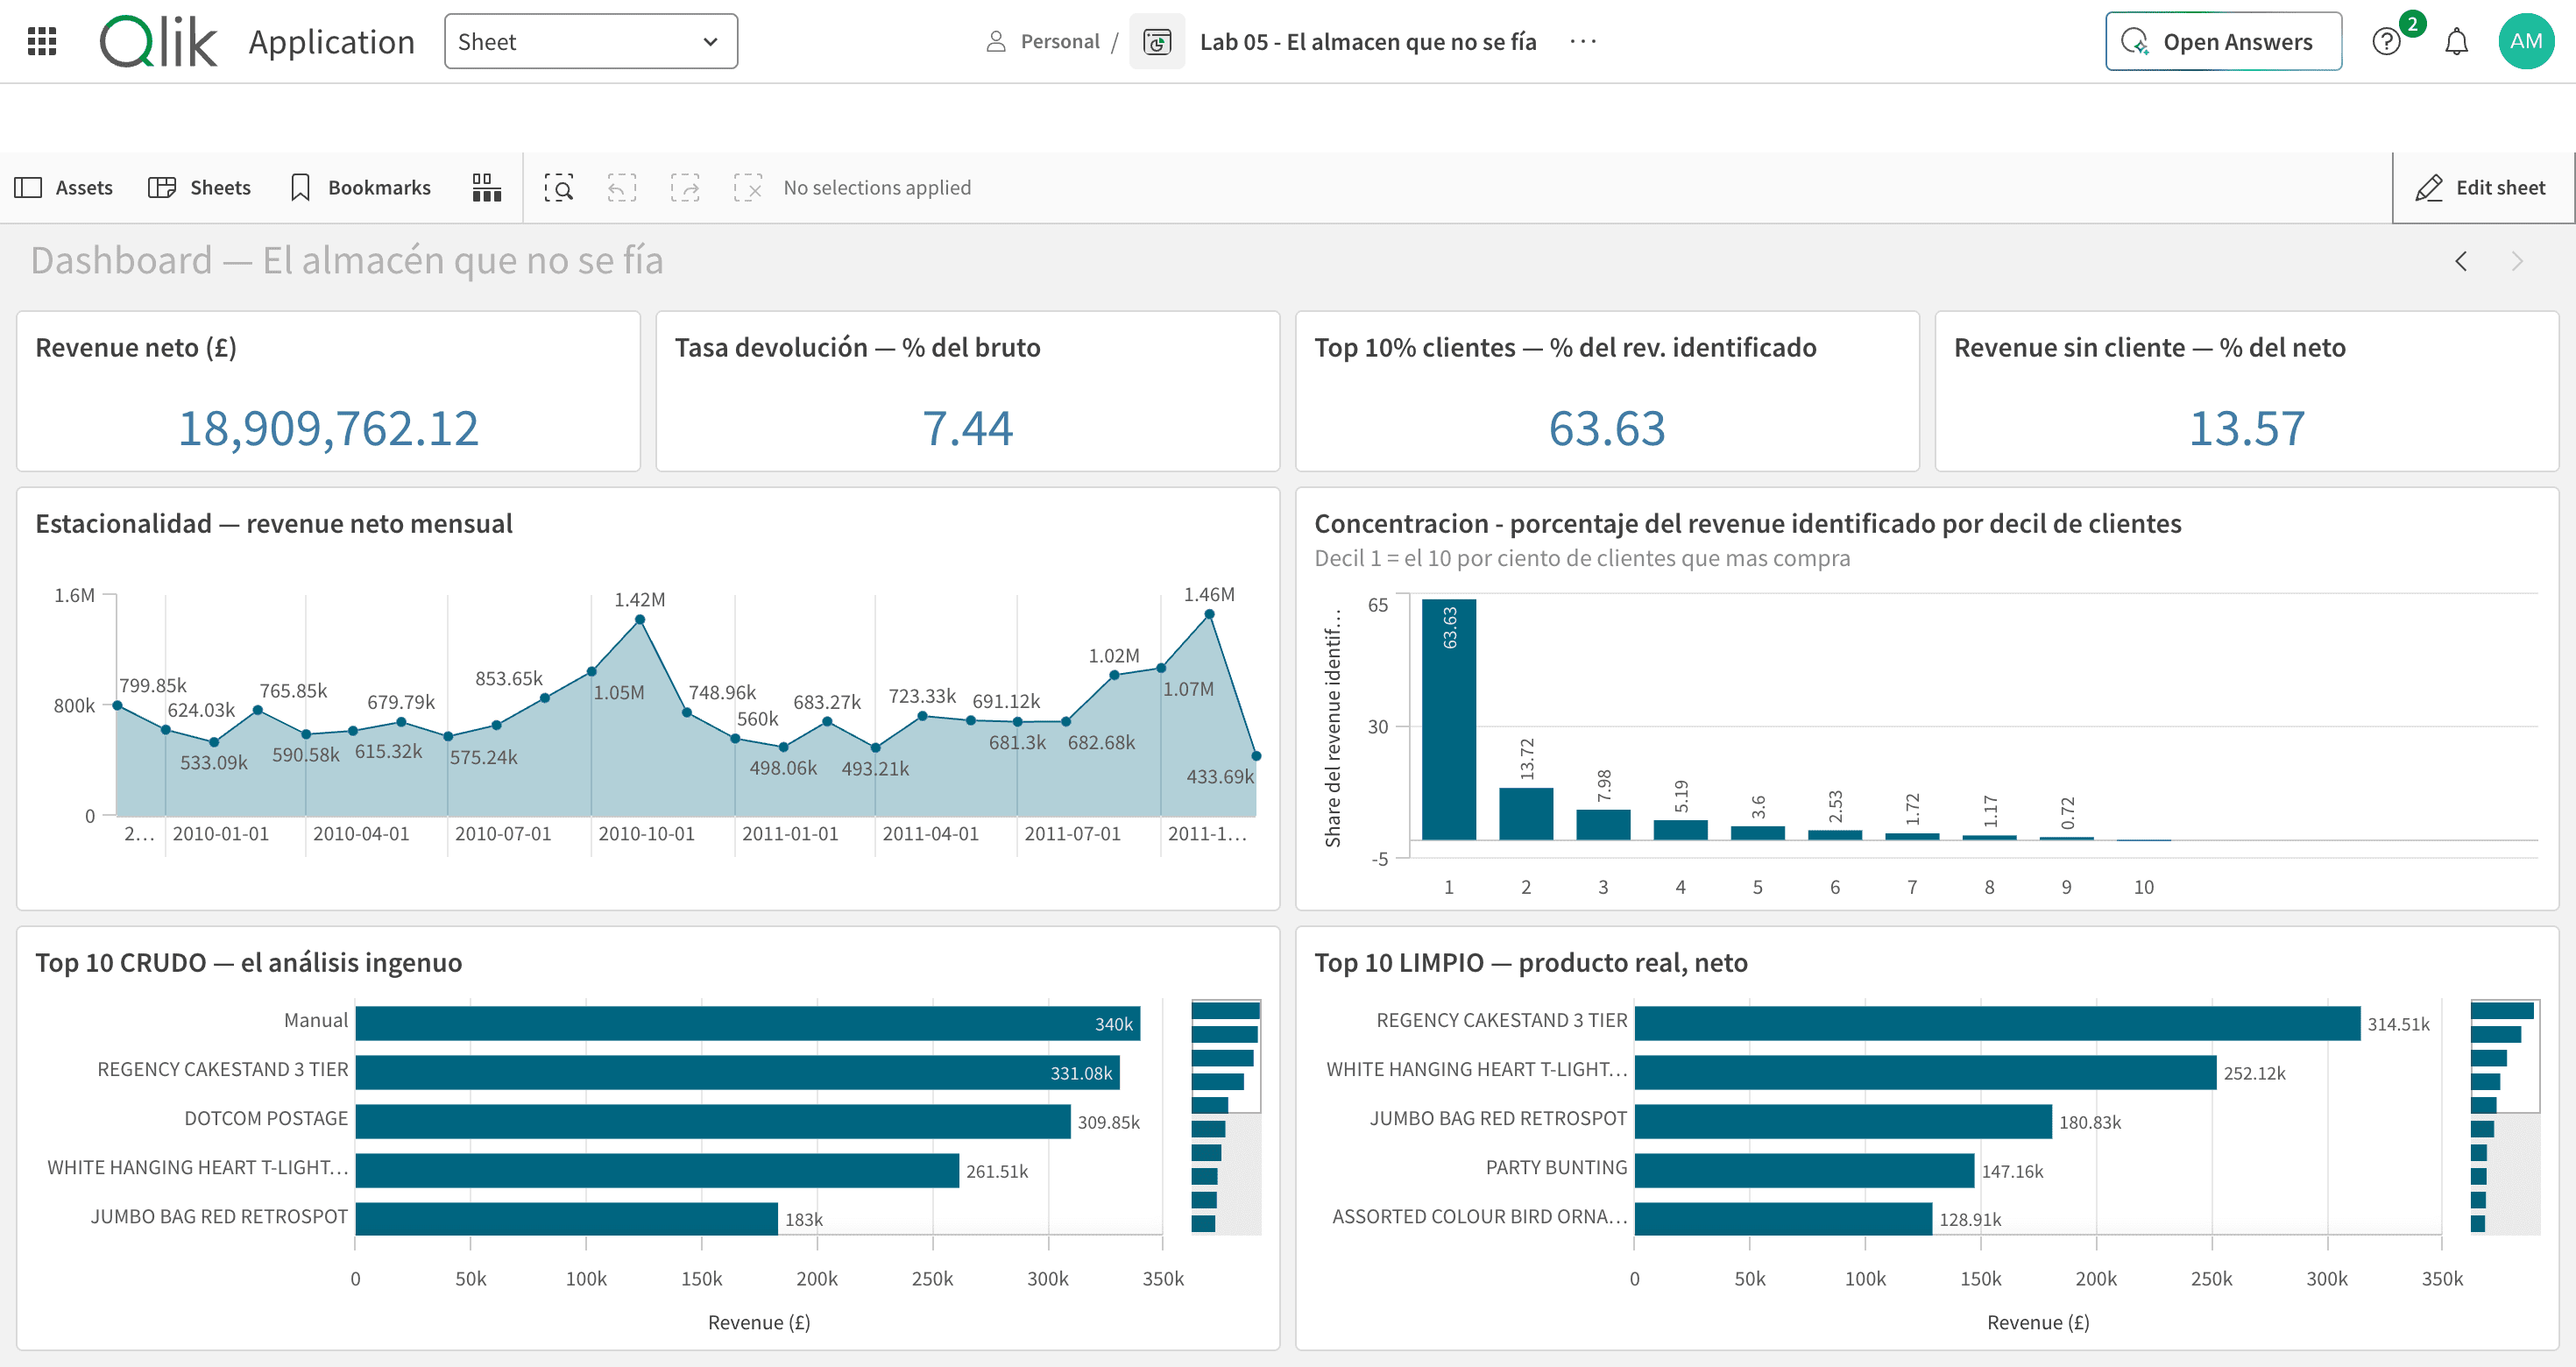
The Qlik Sense Cloud dashboard, fed only by exported CSV files. Its four headline numbers were verified against the warehouse to the penny before this screenshot was taken.
Every model, test, seed and the dashboard itself documented in dbt’s auto-generated docs — one static HTML file, from raw parquet source to the Qlik exposure. Column by column, with the reasoning in the descriptions.
This is one company’s data — a UK gift-ware retailer with a wholesale bias, 2009–2011 — so the KPIs describe that business, not e-commerce in general. The source captured no history, so the product dimension’s versions are derived from the events themselves; a second implementation simulates 25 monthly loads through dbt’s snapshot mechanism and converges on the same versions, which is the point of showing both.
Honest fine print: DuckDB here is a single-node warehouse — the scale conversation is theoretical, though the dbt project ports to a cloud warehouse without changes. The dataset carries no costs, so there are no margins. And the free Qlik tier expires; the screenshot above is the permanent artifact, which is why the page depends on nothing live.