The fire you can’t unsee.
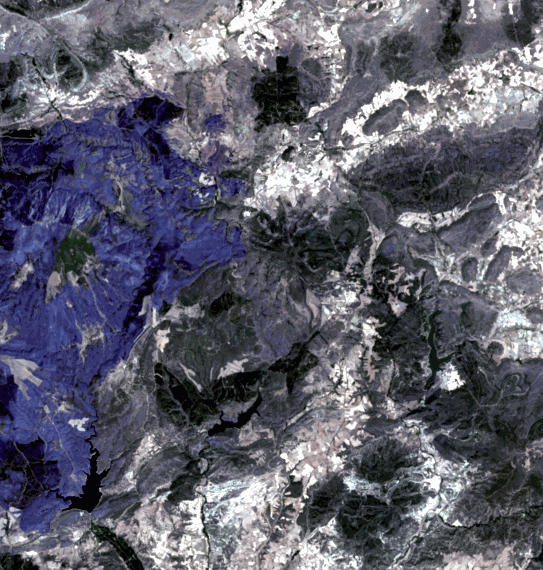
In July 2026 the La Mierla wildfire burned through ~35,000 hectares of the Sierra Norte de Guadalajara — the largest Spanish fire of the year. I rebuilt its story from open Landsat 8/9 data: in optical imagery the fire is a subtle dark stain you could mistake for terrain shadow. In thermal, it is unmissable.
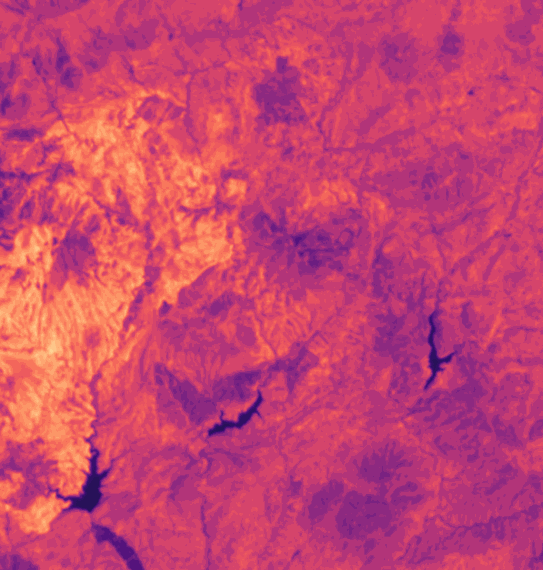
Only thermally anomalous terrain is drawn — each pixel fades in as it moves beyond 2σ from its own June–July baseline. Before the fire, the map is quiet on purpose.
Same satellite, same instant. In the comparator, the left half is surface reflectance — what a camera sees; the right half is land surface temperature from the thermal infrared band, where the burn area radiates at over 60 °C while the surrounding terrain sits 20 degrees cooler.
hottest pixel against its own June–July baseline
burned at moderate severity or above — official figure: 35,268 ha
scar temperature four days after the fire was declared controlled
STAC query against Microsoft Planetary Computer. Twelve Landsat scenes chosen by role: seven for the thermal baseline, one before the fire, three during, one after.
Only the study area is read from each remote cloud-optimized GeoTIFF, via HTTP range requests — no full-scene downloads.
Sensor counts become °C on one common 30 m grid; clouds are masked with the QA band, and every scene is checked against physical bounds before it moves on.
Per-pixel z-scores against each pixel's own June–July statistics, plus dNBR burn severity with water masked out of the equation.
Those checks failed twice along the way, and both failures were real bugs: a study area six times smaller than the fire, and reservoirs classified as high-severity burn. The write-up tells that story.
This is a personal learning project built on open data. Landsat’s thermal band is 100 m resolution with a days-long revisit; commercial thermal constellations operate at another level entirely. The gap between my detected area and the official figure (20,530 vs 35,268 ha) is itself informative: official figures count the full perimeter, while dNBR ≥ 0.27 excludes low-severity ground and unburned islands.
Pipeline: STAC search on Microsoft Planetary Computer → windowed reads from cloud-optimized GeoTIFFs → land surface temperature → per-pixel z-scores against a June–July baseline → dNBR burn severity. Every step validates physical invariants and aborts loudly when one fails — in thermal remote sensing, a wrong number usually looks perfectly fine.
Code on GitHub·Read the write-up·Labs · 02 — the tide you can ride