Every workday morning, thousands of Barcelona's shared bikes pour out of the residential belt — Gràcia, la Sagrada Família, Sants — and pile up along the waterfront and the 22@ tech district. Every evening they climb back up. If you live here you've felt it: the empty dock at 8:50, the full station at the bottom of the hill. I spent three weekends measuring it from open data, and it turned into the best statistics lesson I've had in a while.
The result is an interactive viewer and a repository with the full pipeline. This post is about what the data actually said — including the part where my headline metric turned out to be a trap.
A city photographed every five minutes
Open Data BCN publishes the state of every Bicing station — how many bikes, how many docks — as monthly archives of five-minute snapshots. A year of it (September 2024 to August 2025, the most recent twelve consecutive months the portal has actually published) is 54 million rows covering 548 stations.
The pipeline is five small Python scripts: fetch, aggregate to station-hours, derive flows, backtest a predictor, export two static JSON files for the viewer. No backend, no database; every number on the page was computed by the pipeline, none was typed by hand. And every script checks its output against physical reality — occupation can't exceed capacity, coverage gaps must be reported, bikes must be roughly conserved — and aborts loudly when a check fails. In data work, wrong numbers look perfectly normal. The checks are where this project earns its keep.
The tide, measured
Aggregate each neighbourhood's occupation against its own daily average and the tide appears with almost embarrassing clarity:
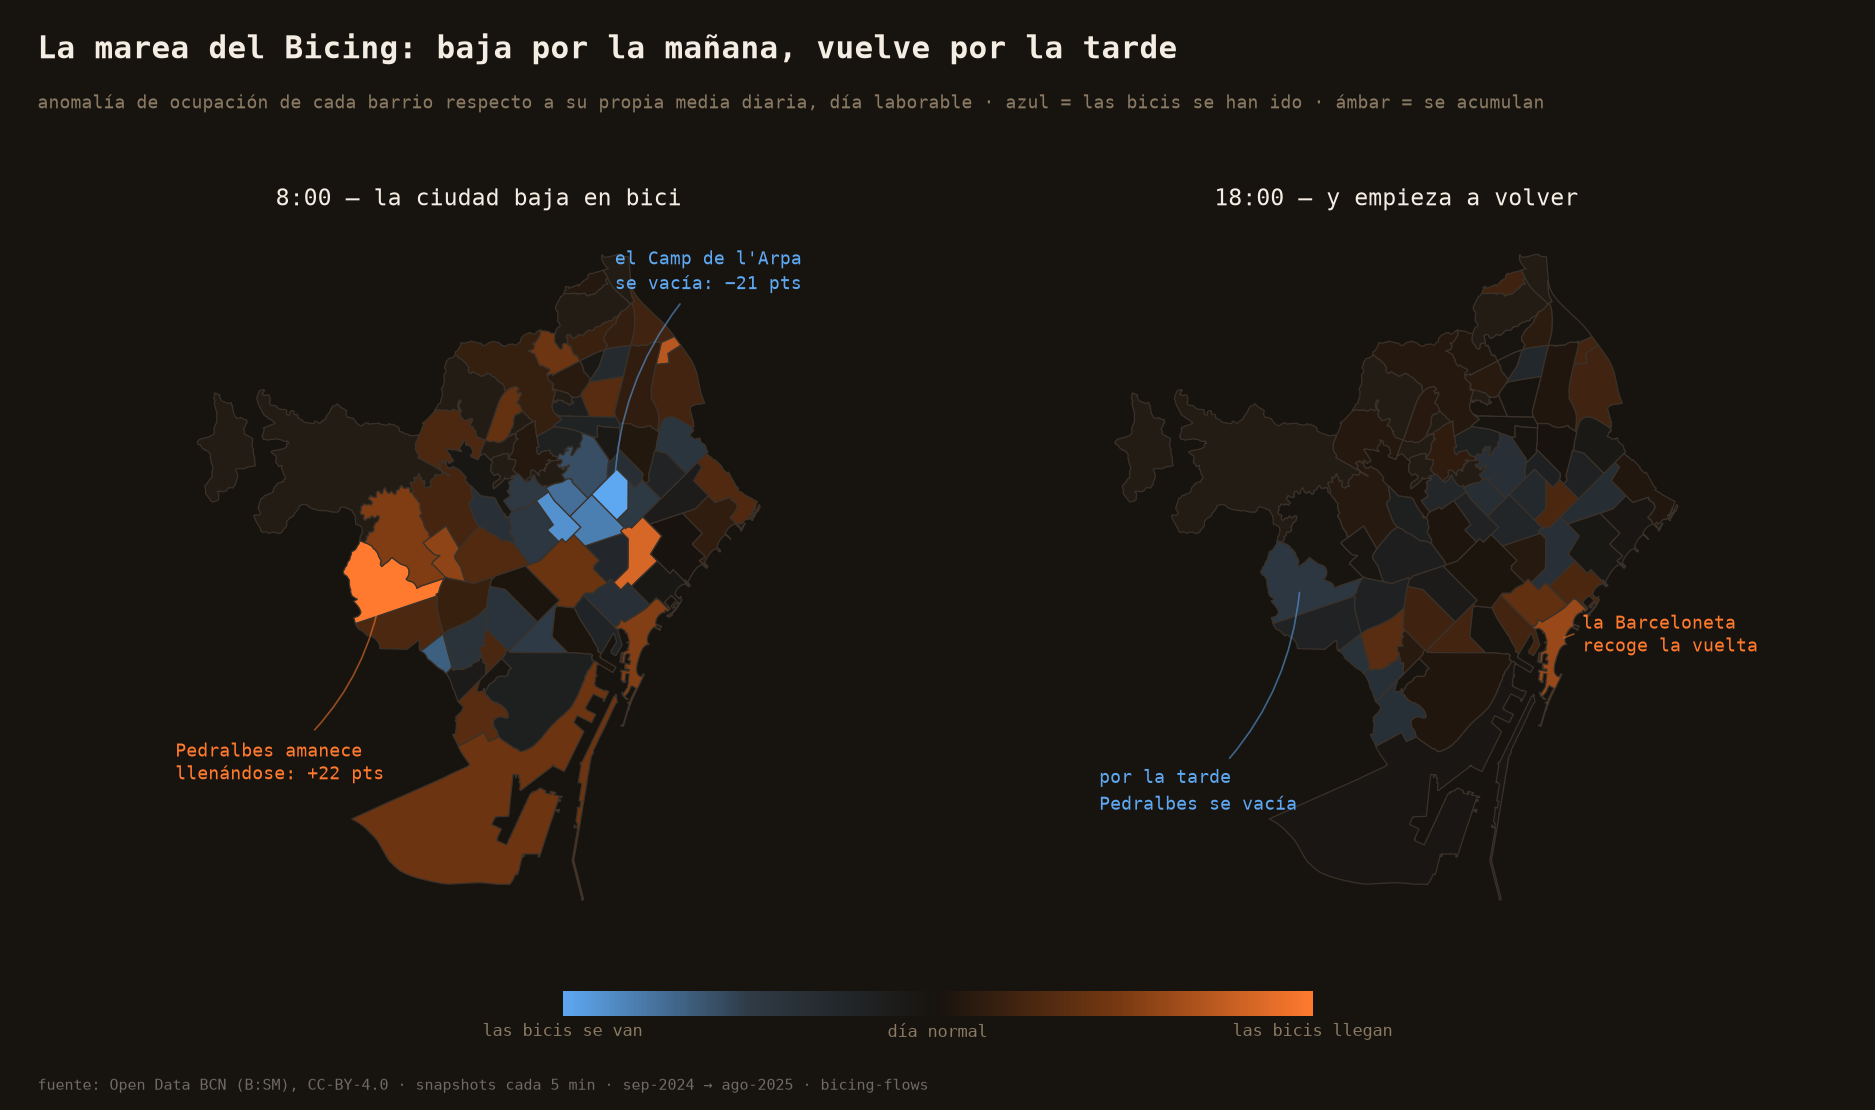
At 8:00, el Camp de l'Arpa del Clot has lost 21 occupation points; Pedralbes has gained 22. The morning ride down is a synchronized spike — the citywide occupancy curve drops into a sharp valley at 8:00 as thousands of bikes are simultaneously in transit. The ride home is different: spread between 17:00 and 22:00, a drizzle instead of a downpour. The city commutes together in the morning and trickles back at its own pace.
August is its own country. The city empties, the bikes stay parked, and the tide almost flattens — which mattered more than I expected when it came to prediction.
The trucks work at night
Bikes should be conserved: one leaves a station, it arrives at another. So I measured the residual — changes in the total number of parked bikes that trips can't explain — expecting a nuisance term to apologize for. It turned out to be a finding:
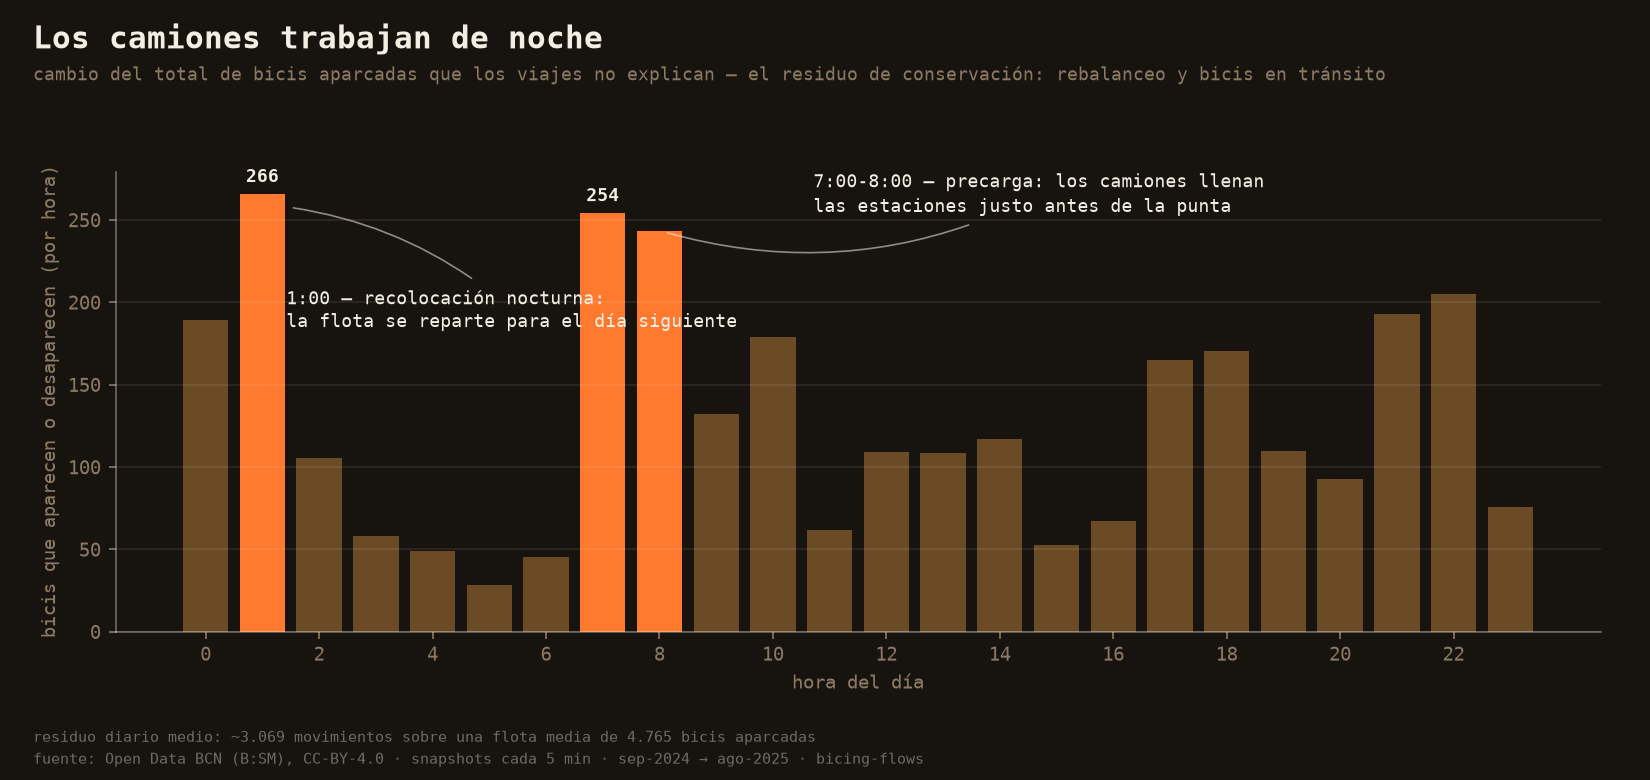
Around 3,069 bikes a day appear or vanish outside normal trips, and the hourly profile is the work schedule of B:SM's rebalancing trucks: a spike at 1:00 (overnight repositioning) and another at 7:00, loading the residential belt right before the rush. The system you ride at 8:00 was hand-balanced for you at dawn.
The 90% accuracy trap
The viewer answers a practical question: will there be a bike at this station, at this hour, on this kind of day? The predictor behind it is deliberately boring — a historical frequency table per station × hour × day-type, no machine learning — backtested on two held-out months.
First run: 90.8% accuracy. Champagne? No: a fake predictor that always answers "yes, there will be a bike" scores 90.8% too, because bikes are there about 91% of the time. My honest baseline had tied a coin with a painted face. That number would have looked great on a slide, and it was worthless — the single best lesson of this lab.
The value lives elsewhere, and it took better questions to find it:
- Warnings. When the baseline says "no bike here", it's right 56% of the time in July, against a ~9% base rate — six times better than chance. The always-yes machine can never warn you at all. The cost: it only catches 9% of bike-less moments.
- Probabilistic skill. As a probability, the baseline's Brier score beats the trivial answer by ~20% — and it's calibrated: when it says 80%, the bike is there 80% of the time.
- The ceiling. No hour-level predictor can beat ~95.7% on this data — a random arrival within the hour is irreducibly uncertain. Context that makes every other number legible.
- August. Trained without ever seeing an August, the predictor limps through one (warning precision drops to 38%). Published, not hidden: a model that has never seen a season doesn't get to claim it.
And the map of where the predictor fails is the tide again: the treacherous stations concentrate in exactly the belt the morning drains. Where the city breathes hardest, the future is hardest to guess.
What broke along the way
Three bugs, all caught by invariants rather than luck: the October daylight saving changeover crashed the aggregation (the 2 AM hour exists twice); stations opening and closing mid-year broke the conservation check until it compared only stable-census hours; and the headline metric itself — the accuracy trap above — was exposed by the requirement that the baseline must meaningfully beat the trivial predictor, not just numerically edge it.
What this is — and isn't
A personal study on a year of open data. The window ends in August 2025 because later months simply don't exist in the portal (their own notes say so); 27 of 8,761 hours are missing inside it, all listed in the repo. The predictor knows nothing about rain, strikes, or a station with three broken docks. What it does know, it states with measured confidence — and where it's blind, it says "I don't know" instead of guessing. That felt like the right way to build it.